
Not So SMART
Why SMART is a Bad Model for Santa Cruz County
[See also: Light Rail SMART Train Fails Voters]
Trains are fantastic. They can efficiently transport large populations. But, as with just about every form of transportation, trains aren’t appropriate everywhere.
The SMART (Sonoma-Marin Area Rail Transit) train in Sonoma and Marin counties has been held up to Santa Cruz County residents as a good example of what local train proponents would like here. It’s ironic that train proponents are pushing this example because the history, data and recent SMART operations (service was initiated in August, 2017 after 13 years of spending) amply demonstrate why a system like SMART makes no sense for Santa Cruz County and will not be funded by its voters.
Below we discuss in detail, and with references, differences between these locations as well as other basics required to make any decision regarding transportation including the fundamentals for light rail systems of which SMART is one.
Population
Sonoma and Marin counties have a combined population of 763,721, about 3 times the Santa Cruz County population of 274,643. In addition, when the SMART Larkspur station is completed, the SMART train will connect via ferry the Sonoma and Marin county populations to the city of San Francisco, which has a population of 870,887.
Of 24 light rail systems in the U.S., all have metro or connected metro populations greater than 1 million. In the case of Santa Cruz County, the proposed train would connect Santa Cruz and Watsonville, with populations of 64,465 and 53,796 respectively.
The population of Santa Cruz County simply cannot support the cost, maintenance and annual operating deficits of a train.
Huge Costs for Low Ridership
The SMART train cost over $566 million through June 30, 2016. Taxpayers in Marin and Sonoma counties are also paying $30 million per year for 20 years (when Measure Q expires) to subsidize SMART through a quarter cent sales tax—so add another $600 million.
Total capital cost plus 20 year operating subsidy for SMART is $1.16 billion. And according to SMART’s most recent annual report, there are only 2,191 train riders on the average weekday. The RTC’s 2015 Rail Transit Feasibility Study showed that Scenario G from Santa Cruz to Watsonville will cost over $500 million over thirty years inclusive of a new 30 year sales tax to fund annual operating deficits.
With unbudgeted items like quiet zones, parking lots, inflation, interest expense and the expected 50% cost overruns on the capital portion of the project, the price tag increases to $700 million. Santa Cruz City recently declared a fiscal emergency. Watsonville has reached its maximum sales tax percentage.
Why would we spend $700 million to move 2,750 round-trips per day, inclusive of only 300 per day from Watsonville?
Little or No Impact on Hwy 1 Traffic
Since its inception in August, 2017, SMART has had little, if any, discernible impact on Hwy 101 traffic in Sonoma and Marin counties. And neither will the proposed Santa Cruz County train, even though fixing traffic congestion is trumpeted by supporters as its primary benefit.
Although hard data on traffic reduction on Hwy 1 is unavailable, based on 2,191 average weekday riders on SMART, we might expect that about 1,000 to 1,500 cars could be taken off Hwy 1. That’s not enough to make a dent in the congestion because Highway 1 has average daily traffic volumes of well over 100,000.
Estimated train ridership in Santa Cruz is also too small to make any difference to traffic on Hwy 1, even if you believe the RTC’s optimistic ridership estimates. Around 50% of Hwy 1 commuters continue over Hwy 17, so they are not candidates for a train.
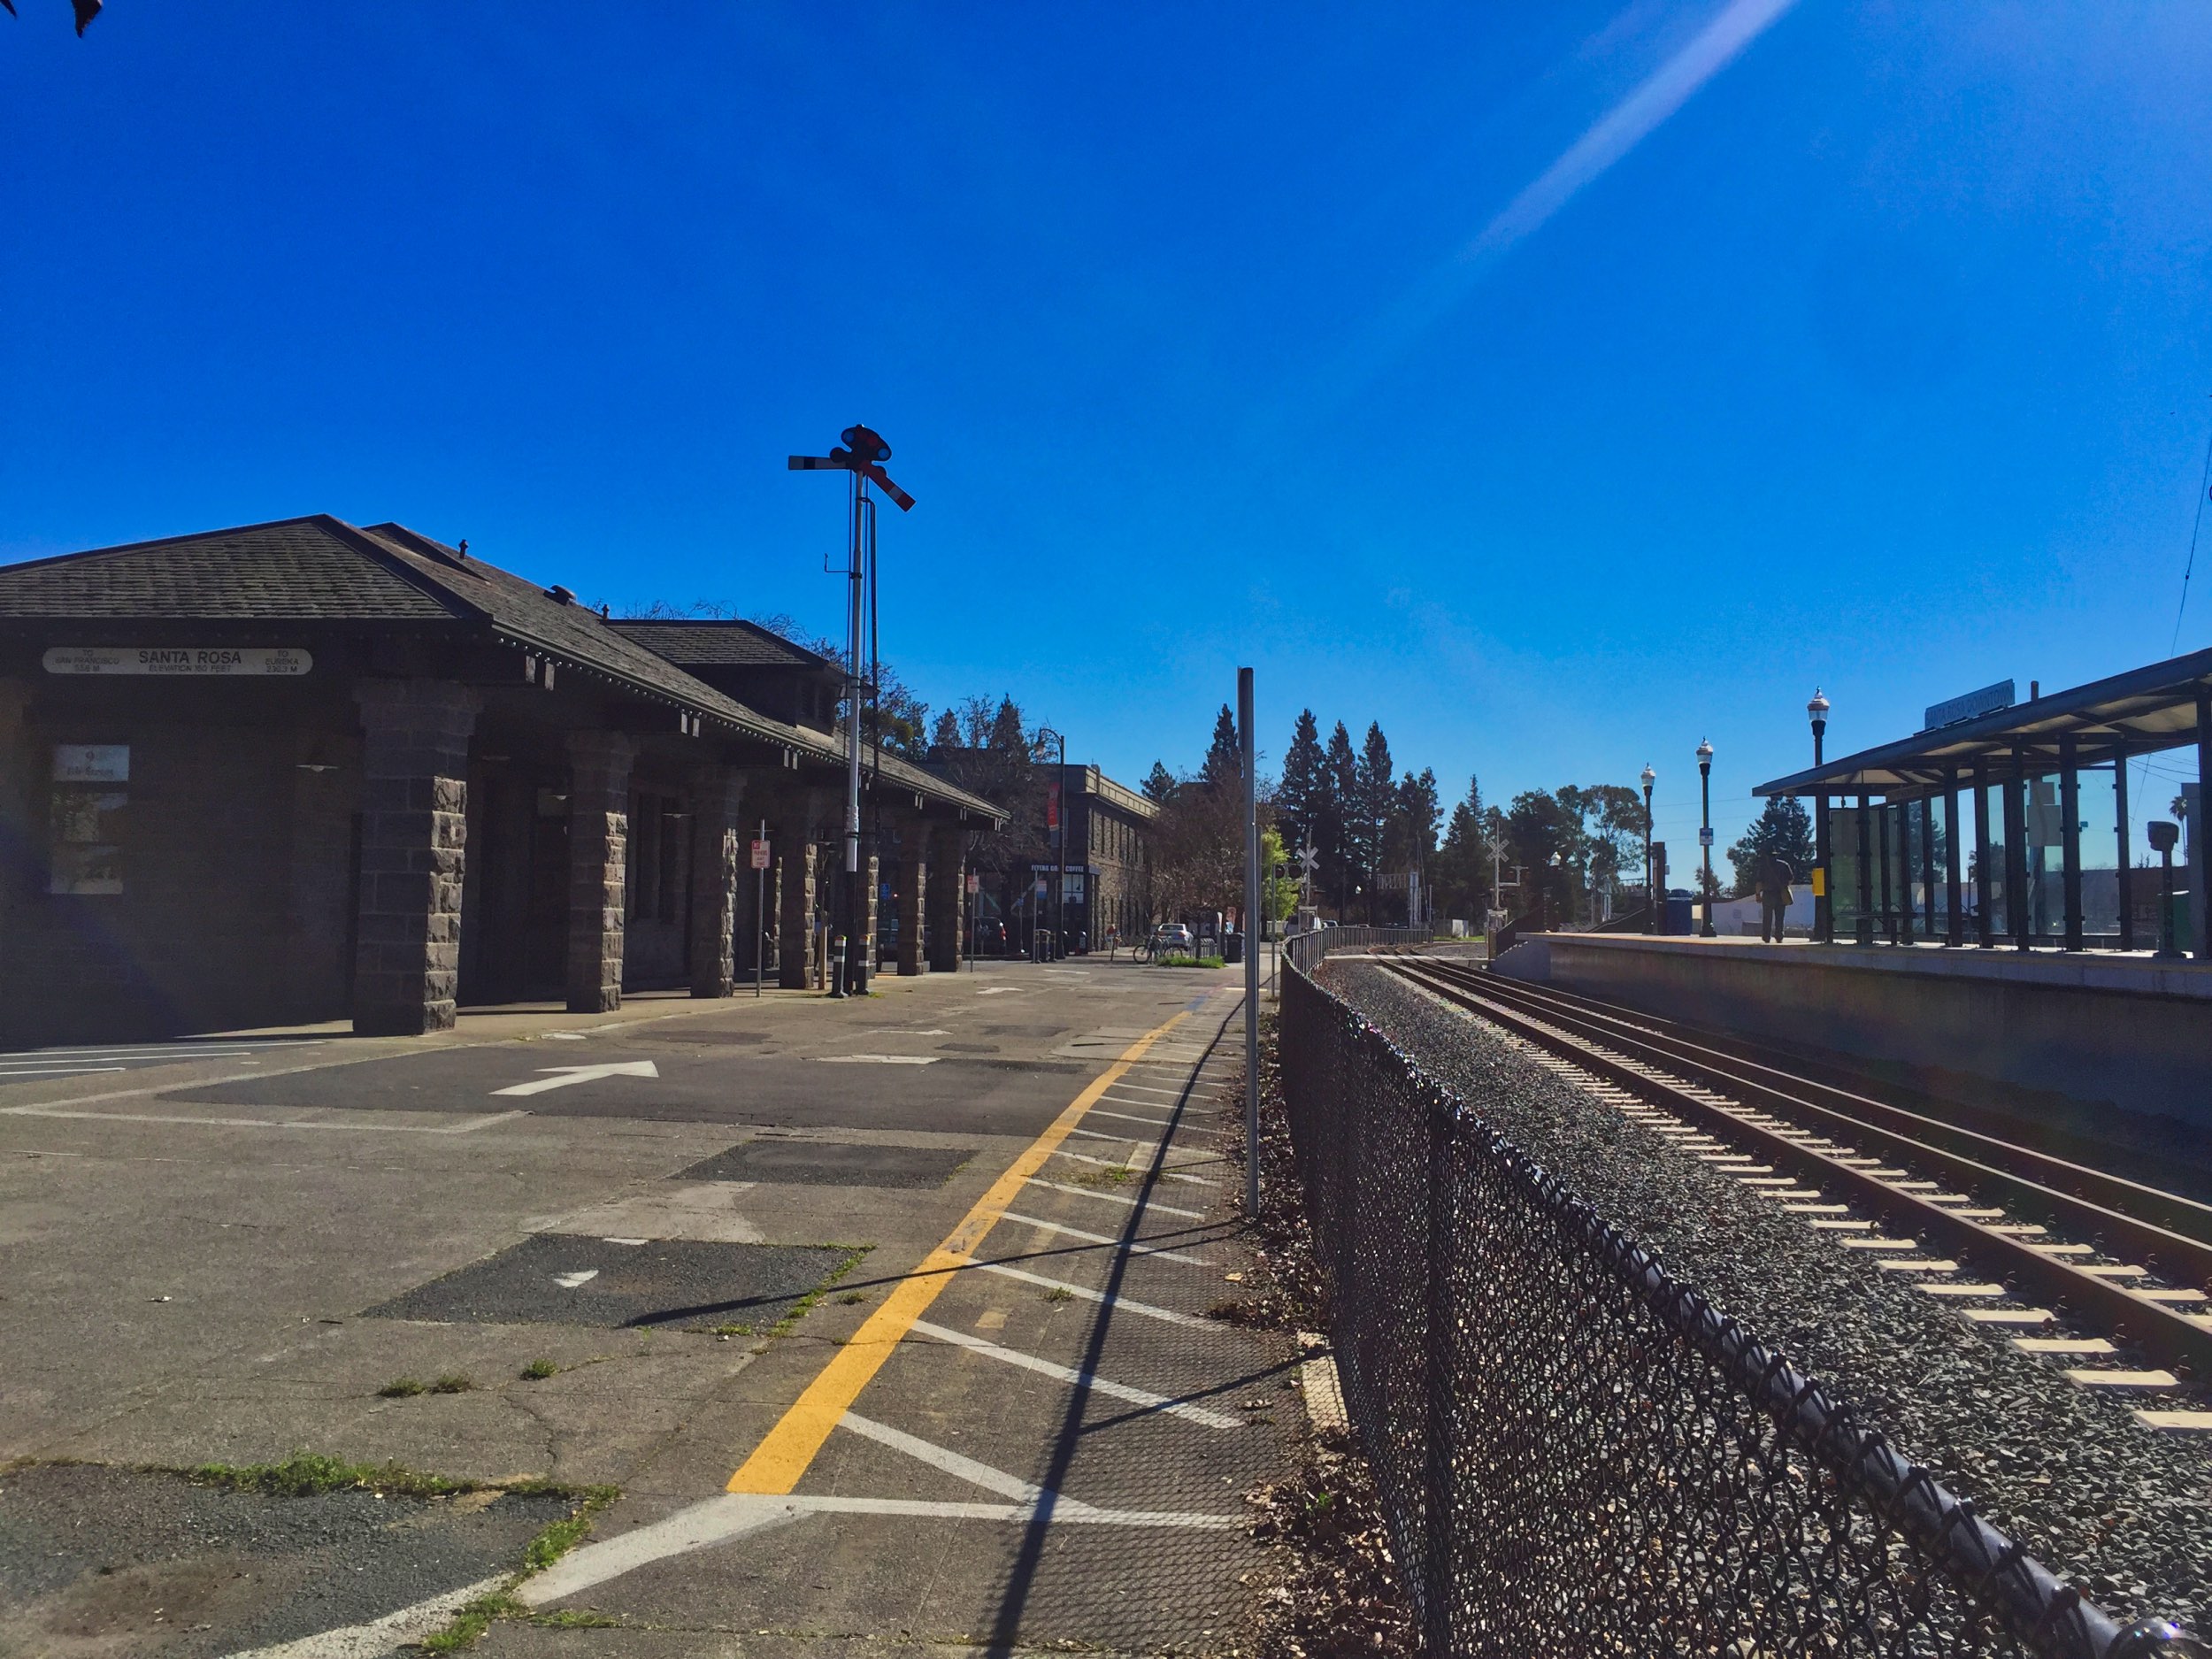
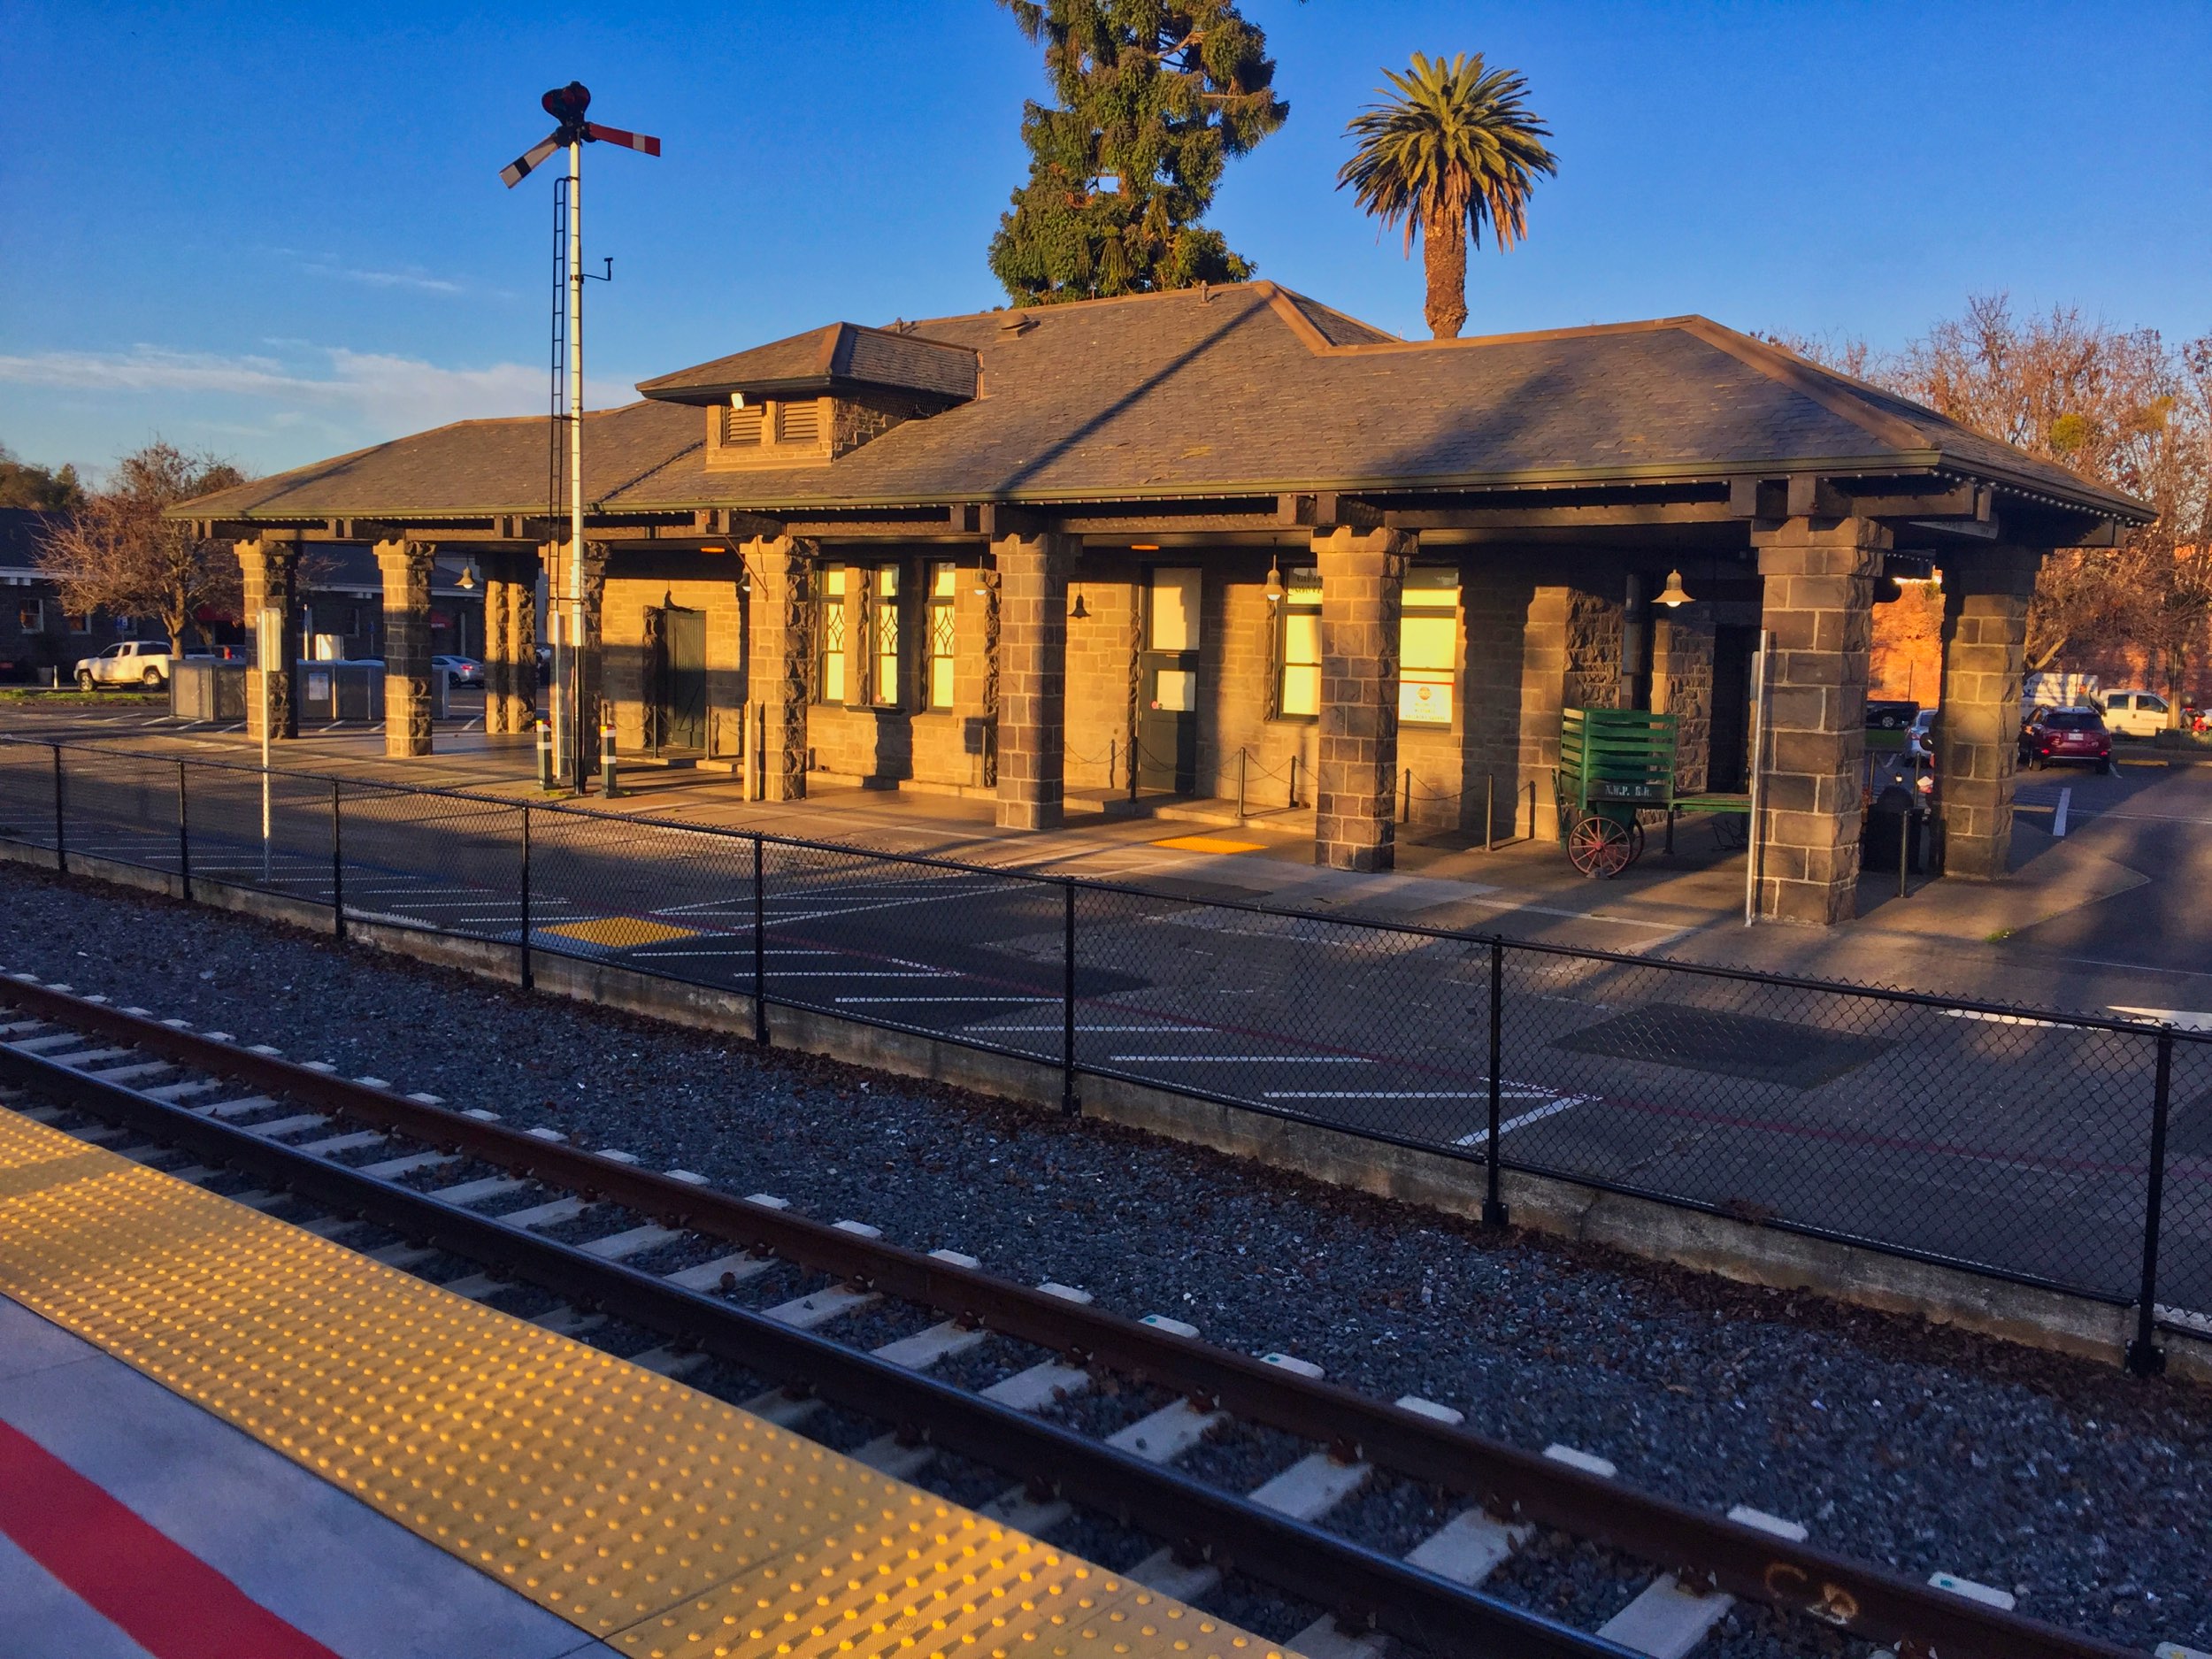
Few Employers Near Train Stations
If you’re wondering why SMART is carrying only 2,191 riders on average per weekday, besides a low population, there are few large employers located near SMART stations. In Santa Rosa, the average distance to a SMART station for the largest employers is 2 miles, in Petaluma, for its largest employers, it’s 2.4 miles, and in San Rafael it’s 0.75 miles.
Most of the large employers in Santa Cruz County are a mile or more from a proposed train station.
A Fence Will Divide Neighborhoods (and Limit Beach Access Along the Tracks in Santa Cruz)
The pictures below show the SMART fence which separates the rail line from a potential bike path, much of which has not been built despite SMART’s promises to build it.
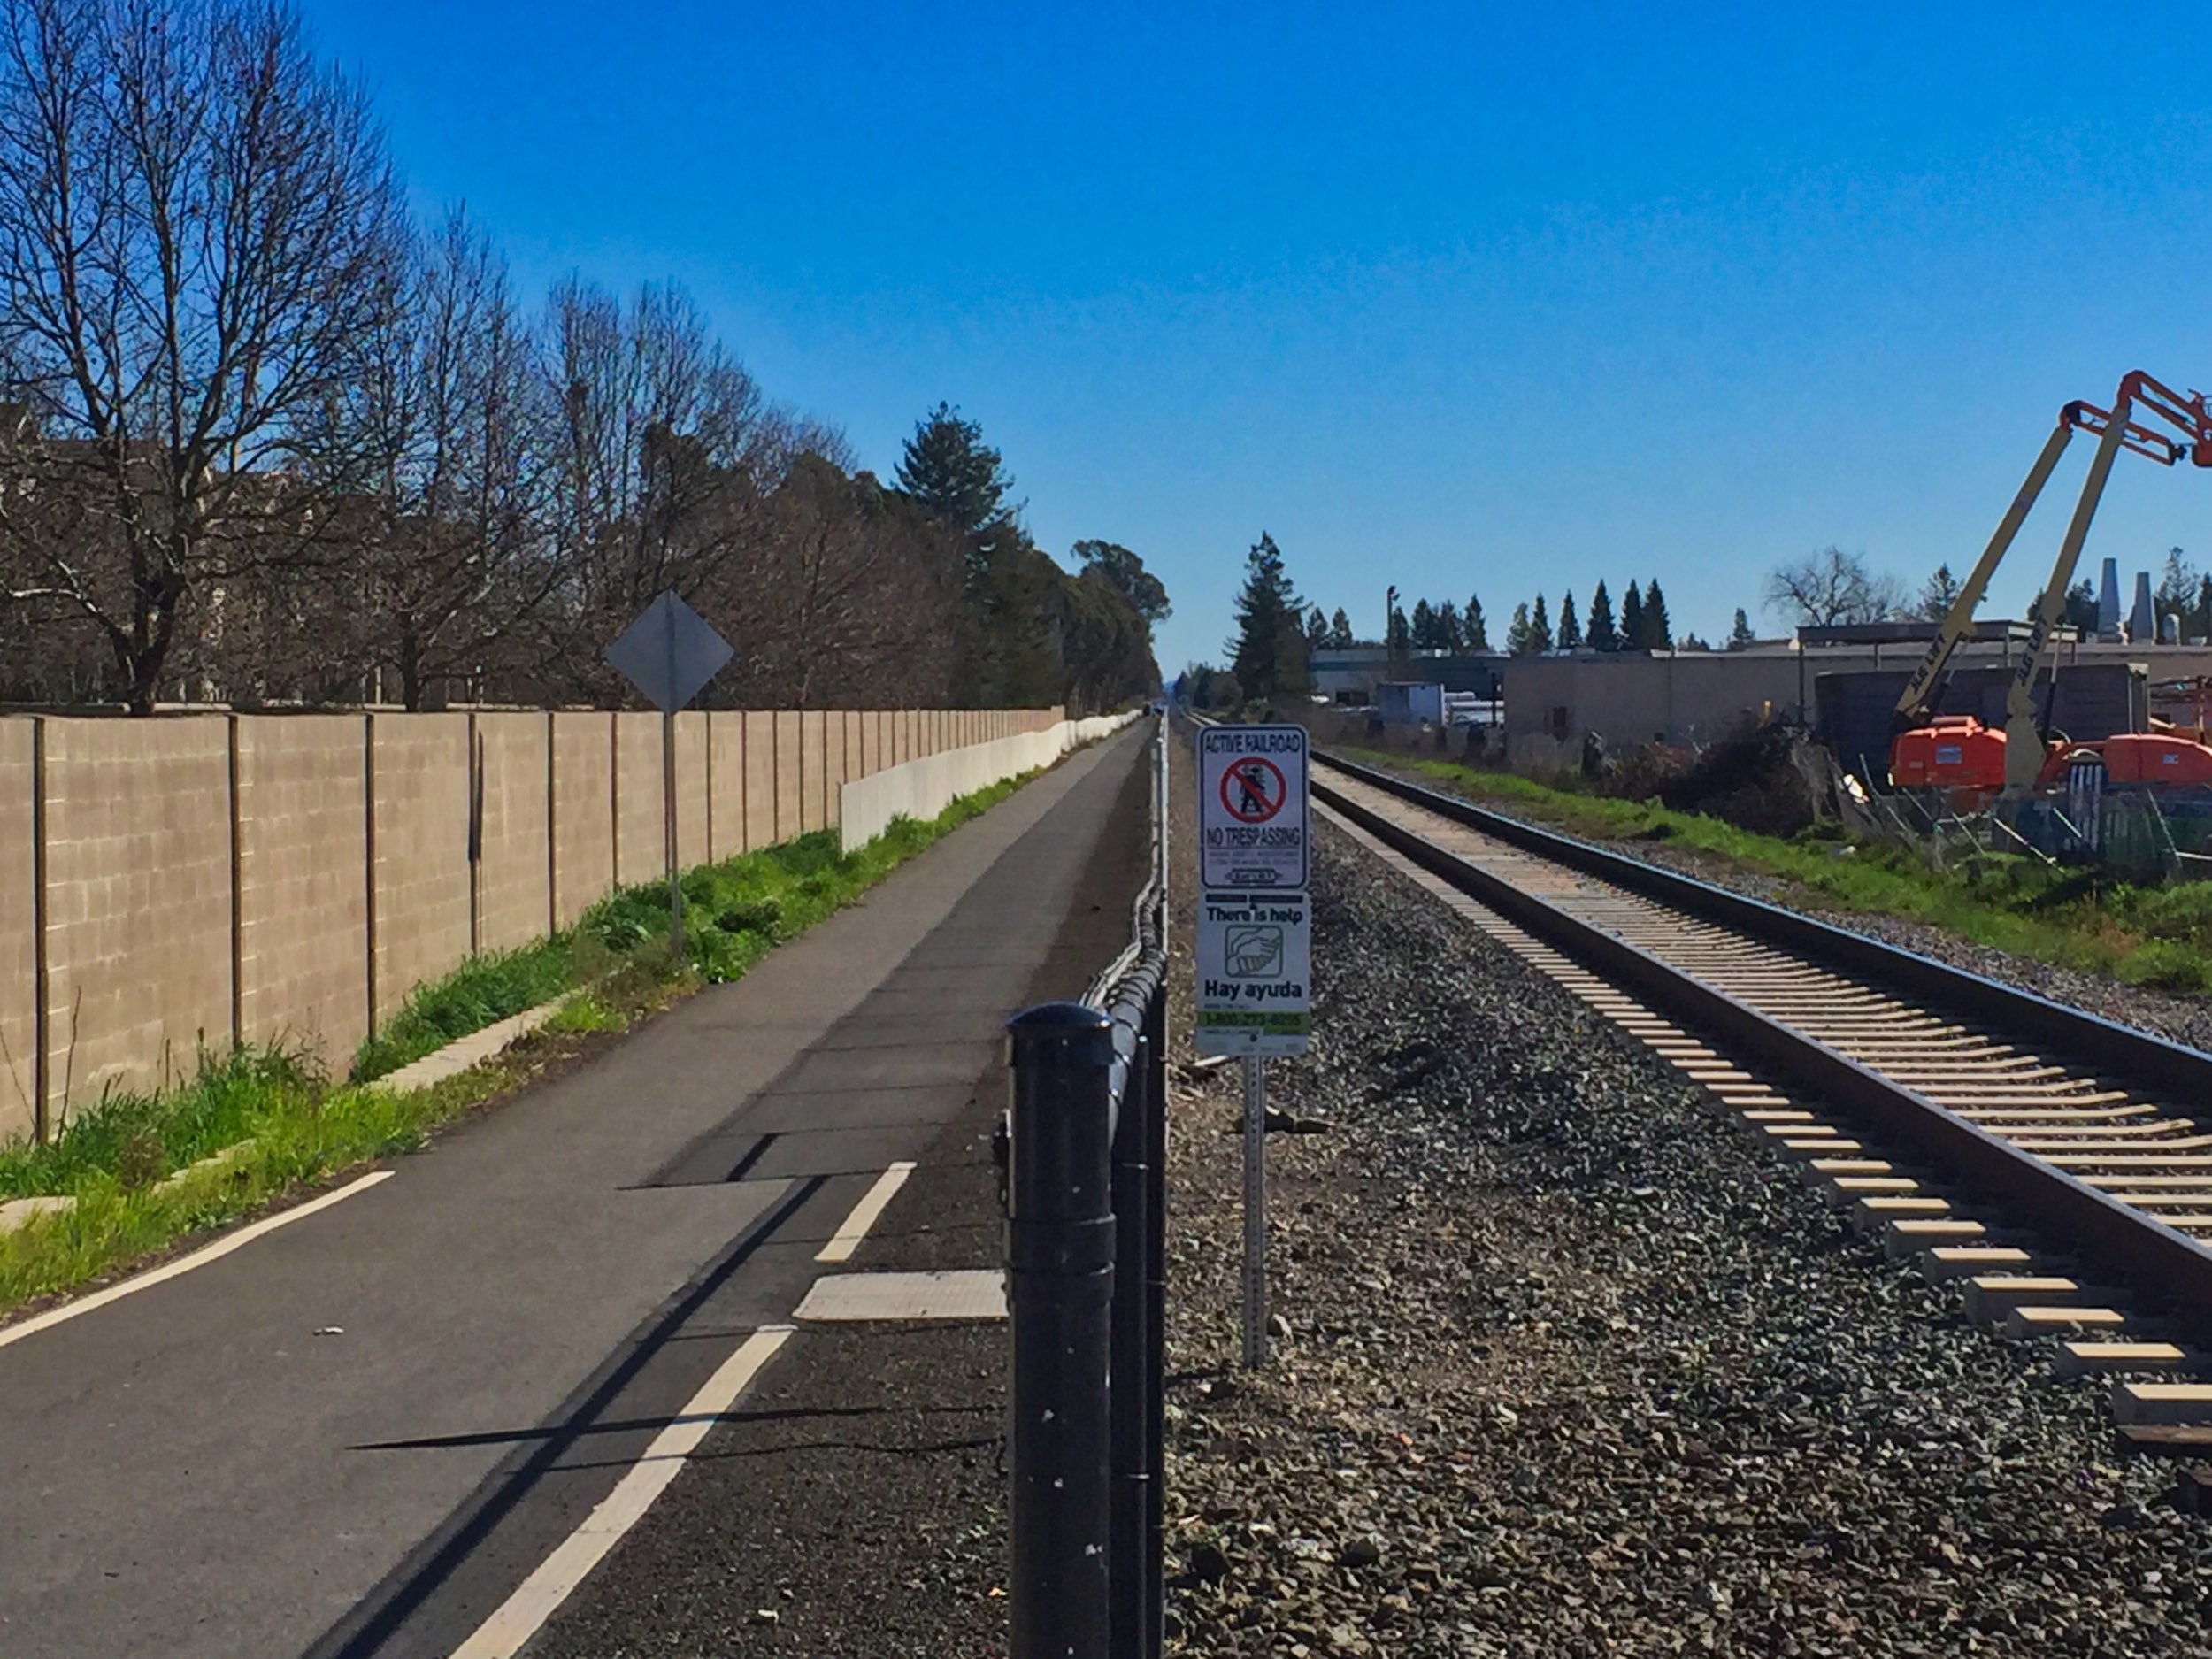
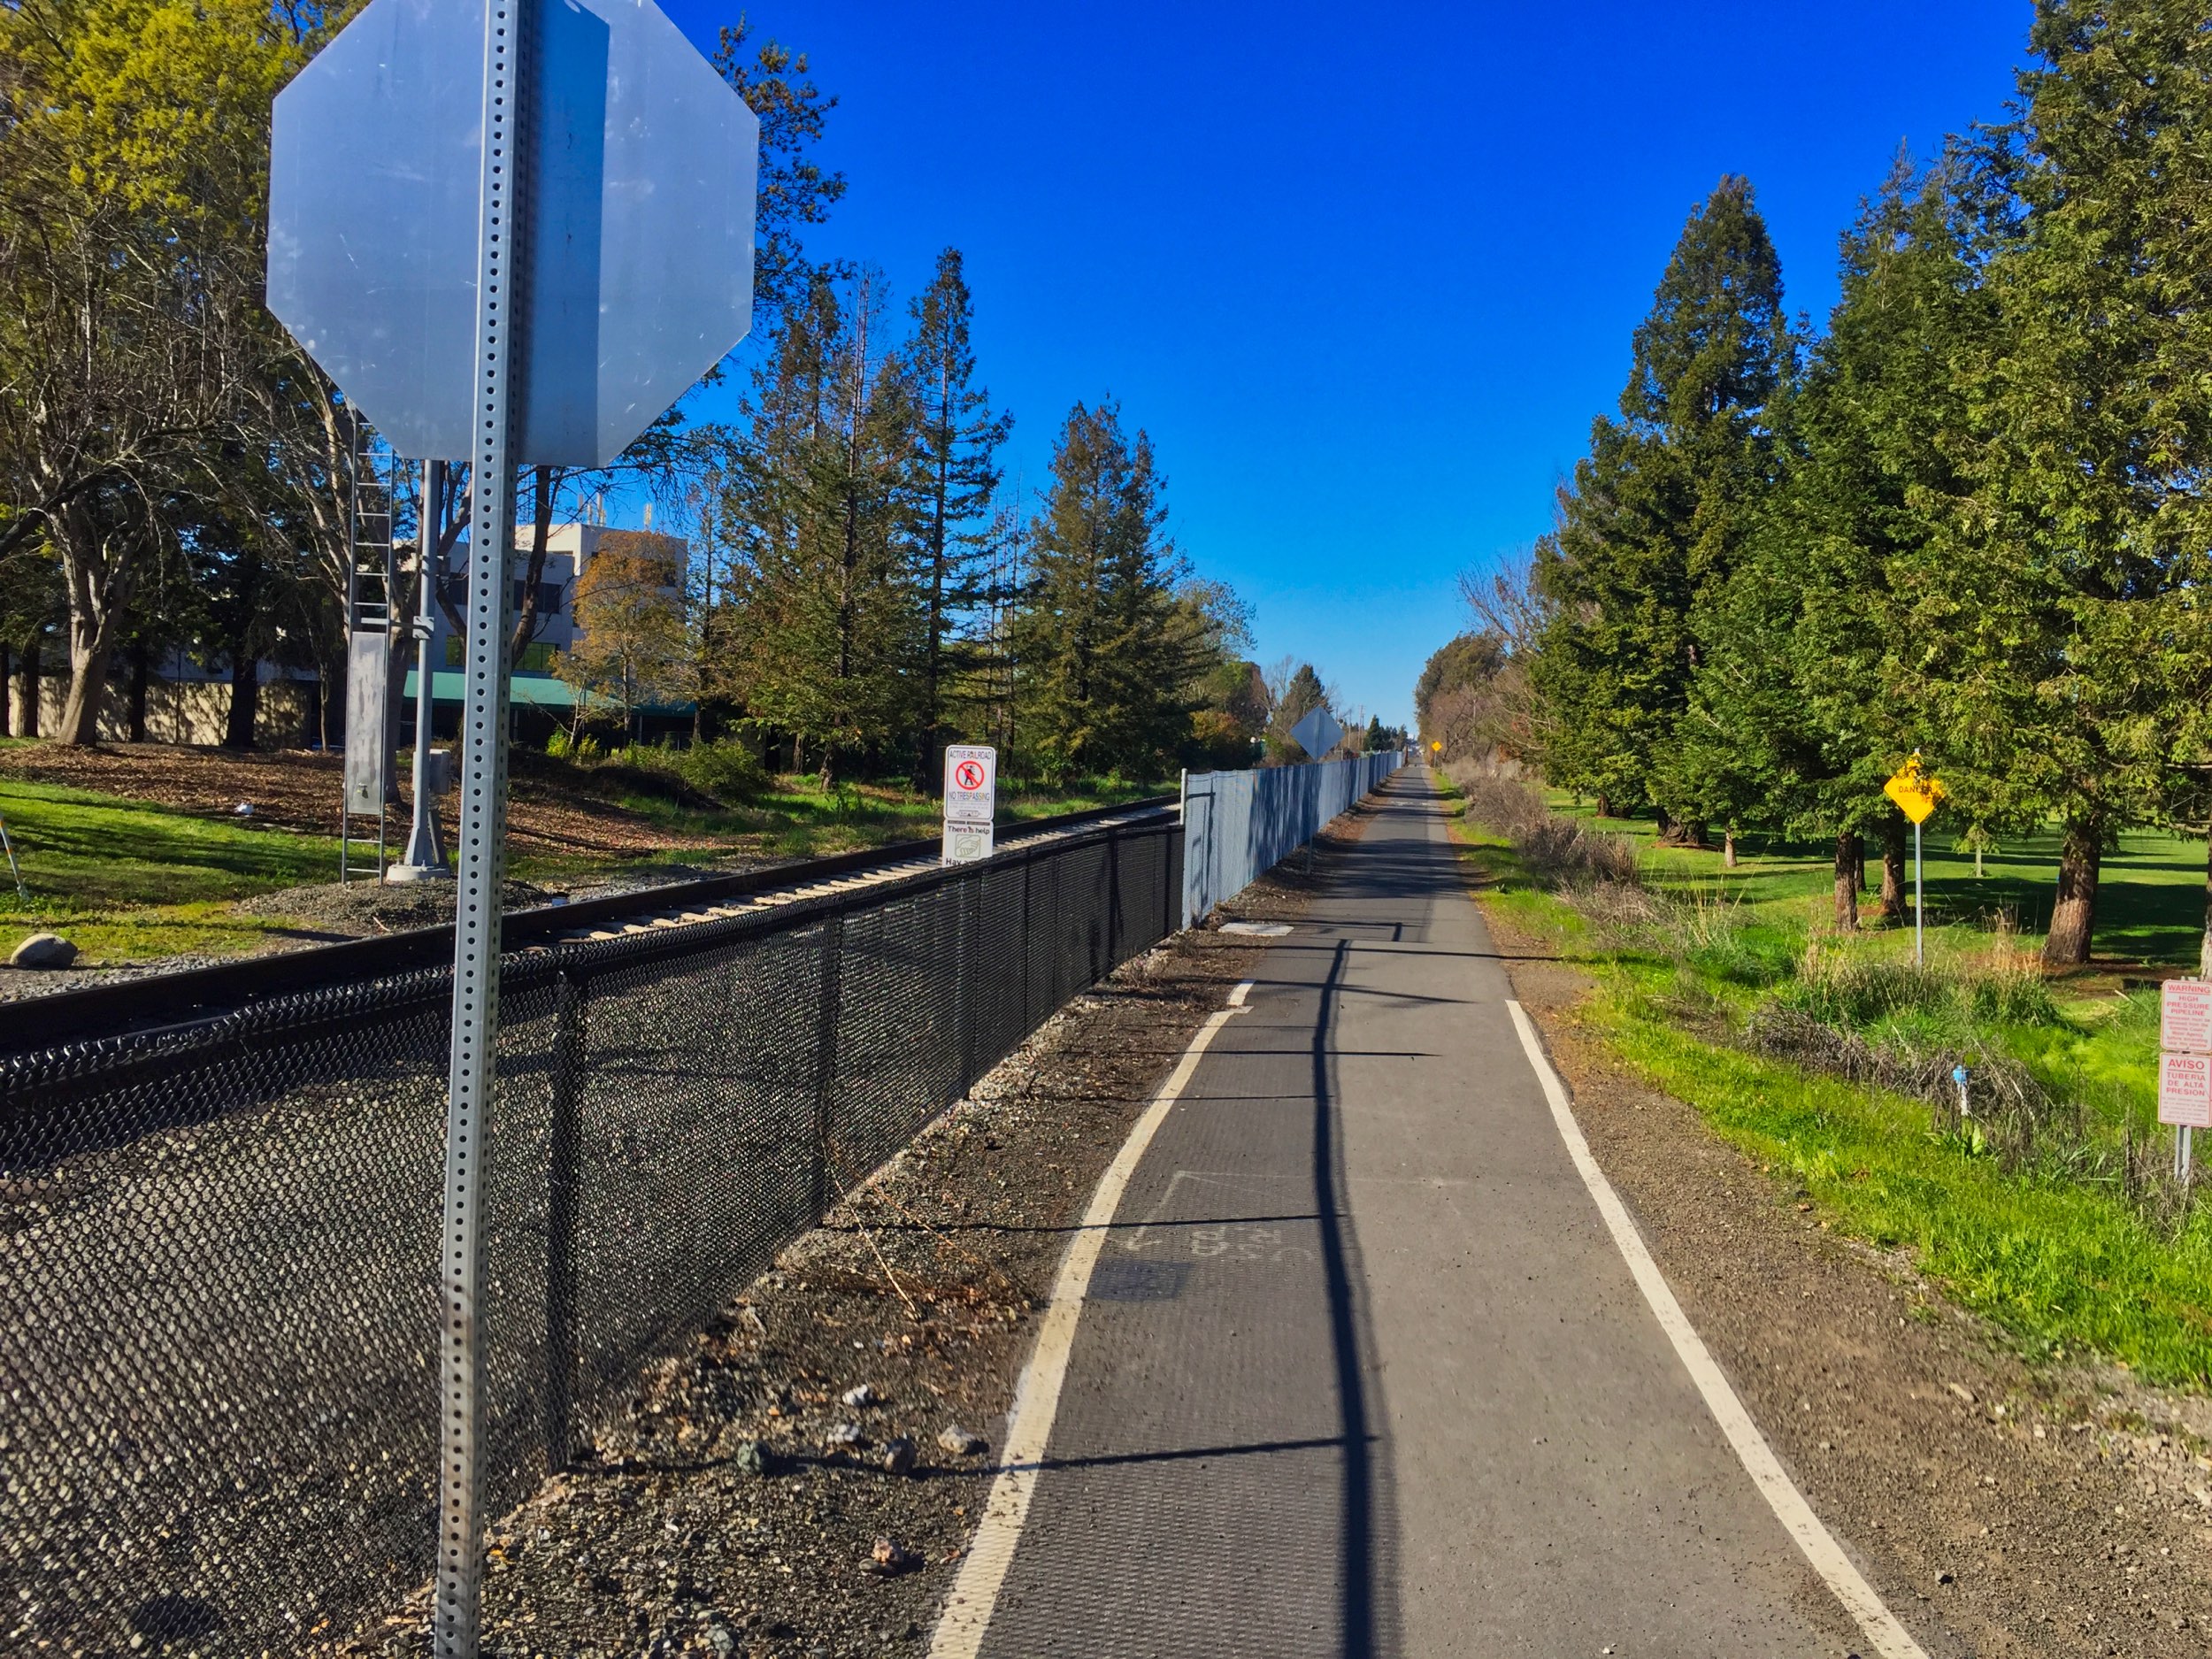
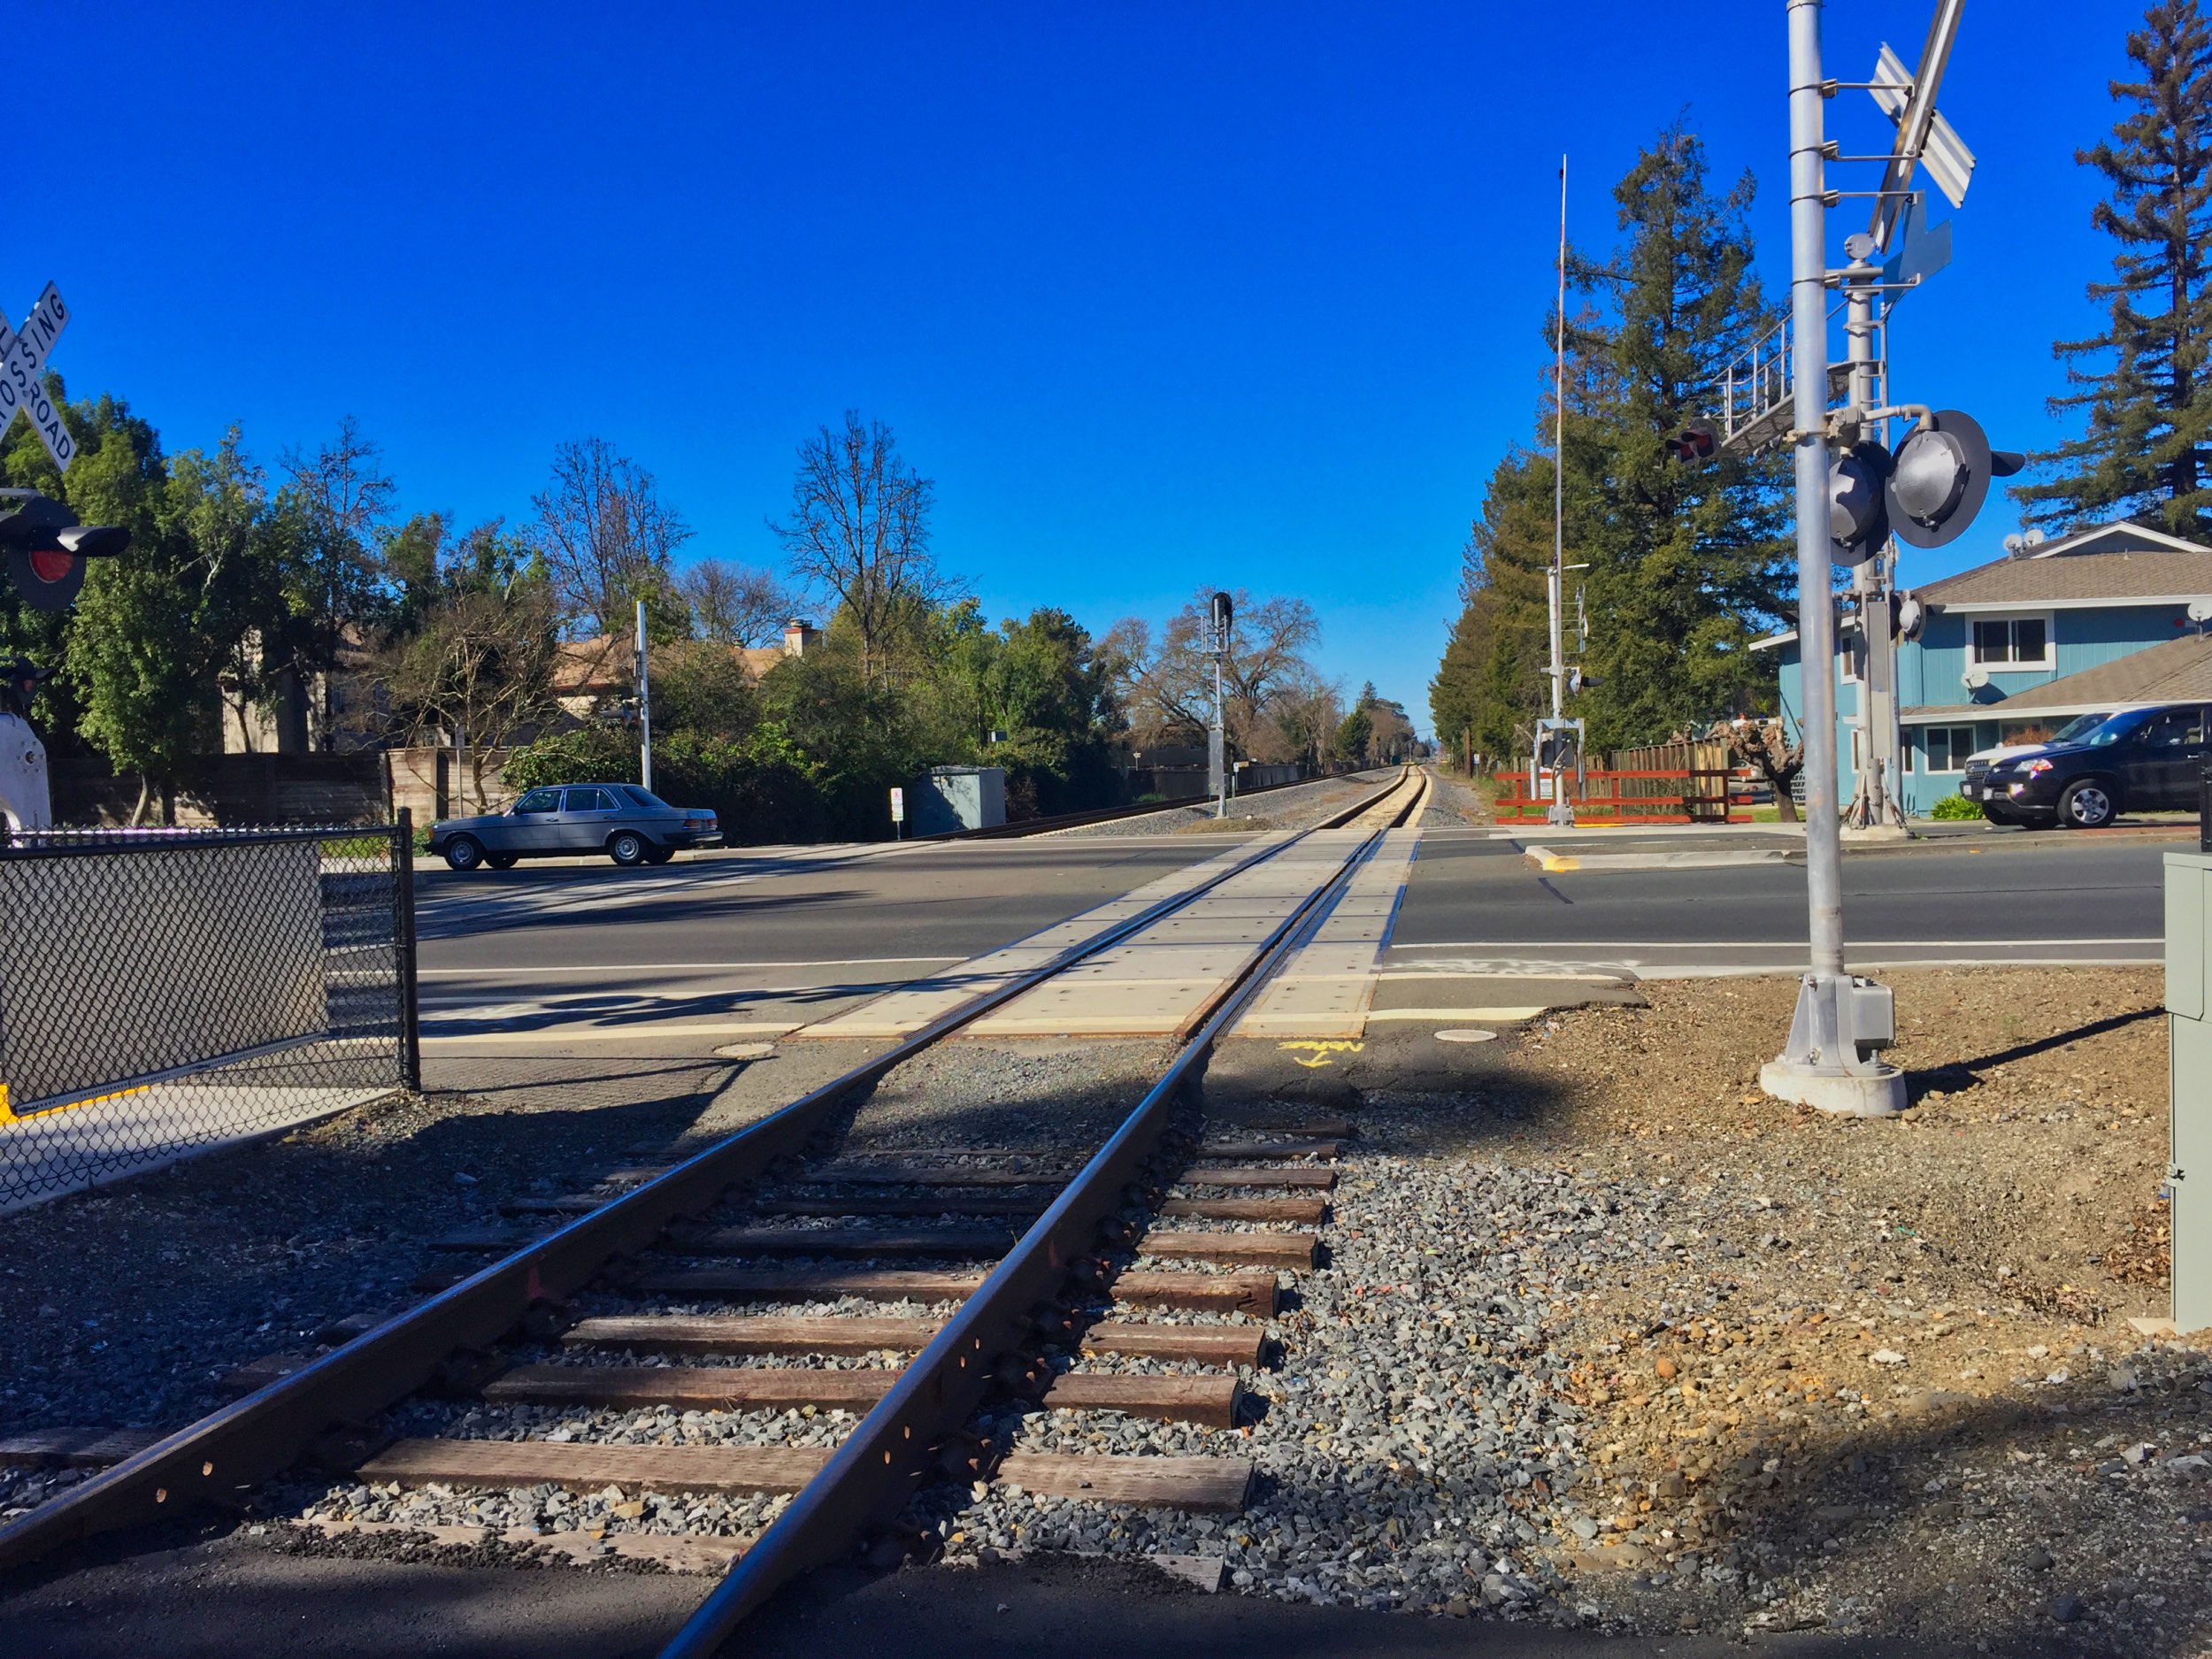
A fence is legally required to separate a bike/pedestrian path from train tracks.
Santa Cruz County will have a new fence dividing neighborhoods and cutting off existing access to the beach.
Diesel Train
SMART runs seven two-car Nippon Sharyo train sets.

By Sonoma-rich at English Wikipedia, CC BY-SA 3.0
Each DMU (Diesel Modified Unit) is powered by a Cummins GSK 19-R diesel engine. Santa Cruz County is proposing to do the same.
In Santa Cruz County, electric trains were eliminated from consideration in the RTC’s 2015 Rail Transit Feasibility Study because they were deemed too expensive (the study estimated the cost at $50-$100 million per mile—see Section 8.2.4 page 151 of the RTFS).
High Fares
All public transit, including SMART, is subsidized but the fares are still illuminating.

SMART Fares as of May 5, 2018
A 20 mile three zone fare for SMART is $7.50 each way, or $15.00 round-trip, which equates to $3,750 for 50 weeks of commuting. Full-fare for a Clipper Card for unlimited monthly use is $200 per month or $2,400 per year.
We chose 20 miles because Watsonville to Santa Cruz is approximately the same distance. A monthly bus fare in Santa Cruz County is $65 per month or $780 per year. In other words, train fares, even unlimited use fares, may be 3 times more expensive than bus fares.
For those workers in the hospitality industry making minimum wage and working non-commute time hours, it seems unlikely that they would pay 3 times the transportation cost to get to and from work. The cost to park is $2 per day if one drives to the station, so add another $44 per month or $528 per year to the SMART passenger fare costs below, not including last mile transportation costs.
Substantial Tree Removal
Although the SMART train traverses some environmentally sensitive areas, building the SMART infrastructure did not require large numbers of heritage trees to be cut down or the extensive excavating projects that would be required in Santa Cruz County. By contrast, building what is proposed in the current Santa Cruz County RTC/MBSST plan (trail next to the tracks) will require hundreds of heritage trees to be cut down, large amounts of earth to be moved, and miles of high retaining walls to be built.
A professional count of trees in just Segments 9, 10 and a portion of Segment 11 showed 307 trees would need to be cut down and it is estimated that this number is close to 1,000 for the entire corridor.
For a detailed view of the impact of the effective width of the corridor, see Trail Width Matters.
Bike Path Gets Secondary Status
Sonoma and Marin counties have watched as anticipated funding dried up, the train was prioritized and very little of the bike and pedestrian path is built. Train projects often cannibalize other transportation funding, and we can expect the same phenomena in Santa Cruz County.
The RTC’s proposed Monterey Bay Sanctuary Scenic Trail detours onto busy city streets in Capitola, La Selva and Watsonville, and those are only the portions we know of today. Watsonville loses most of its “trail” with a major 3 mile detour onto San Andreas Road and W. Beach Street. The trail through Capitola runs down steep Cliff Drive and Monterey Ave and through downtown Capitola.
Room for Parking
Six of the ten SMART stations provide between 45 and 115 parking spaces for commuters.
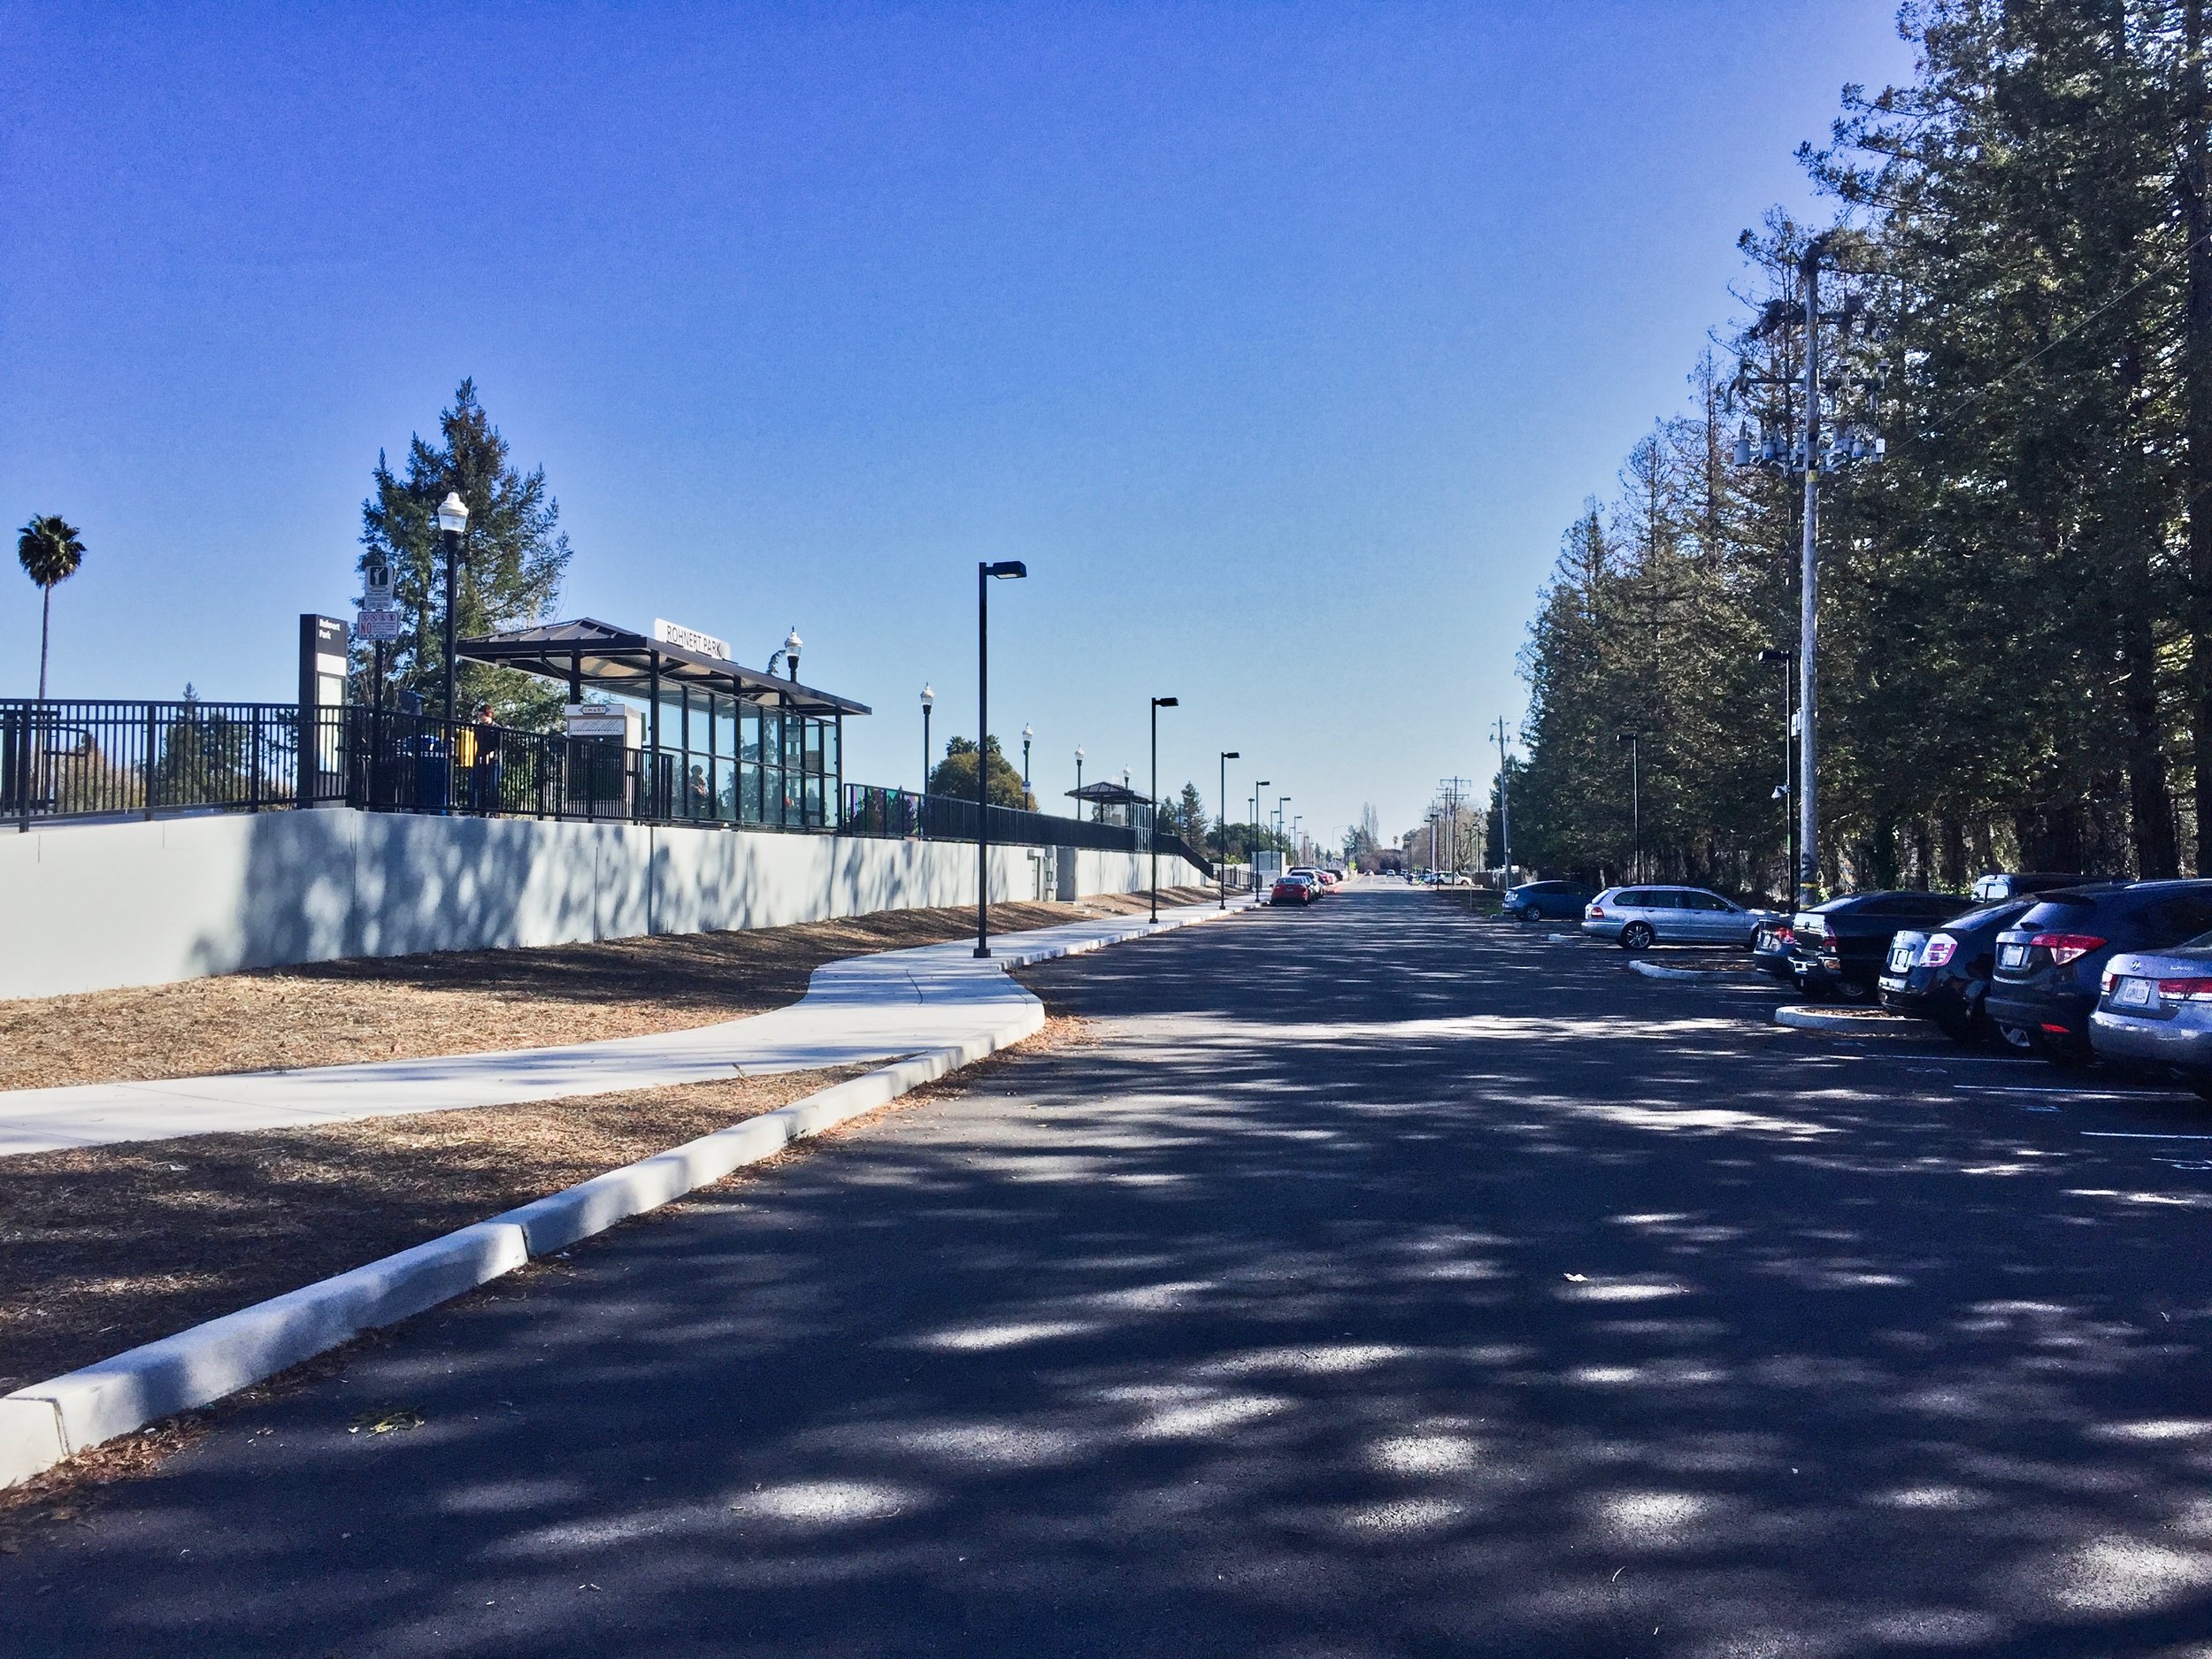
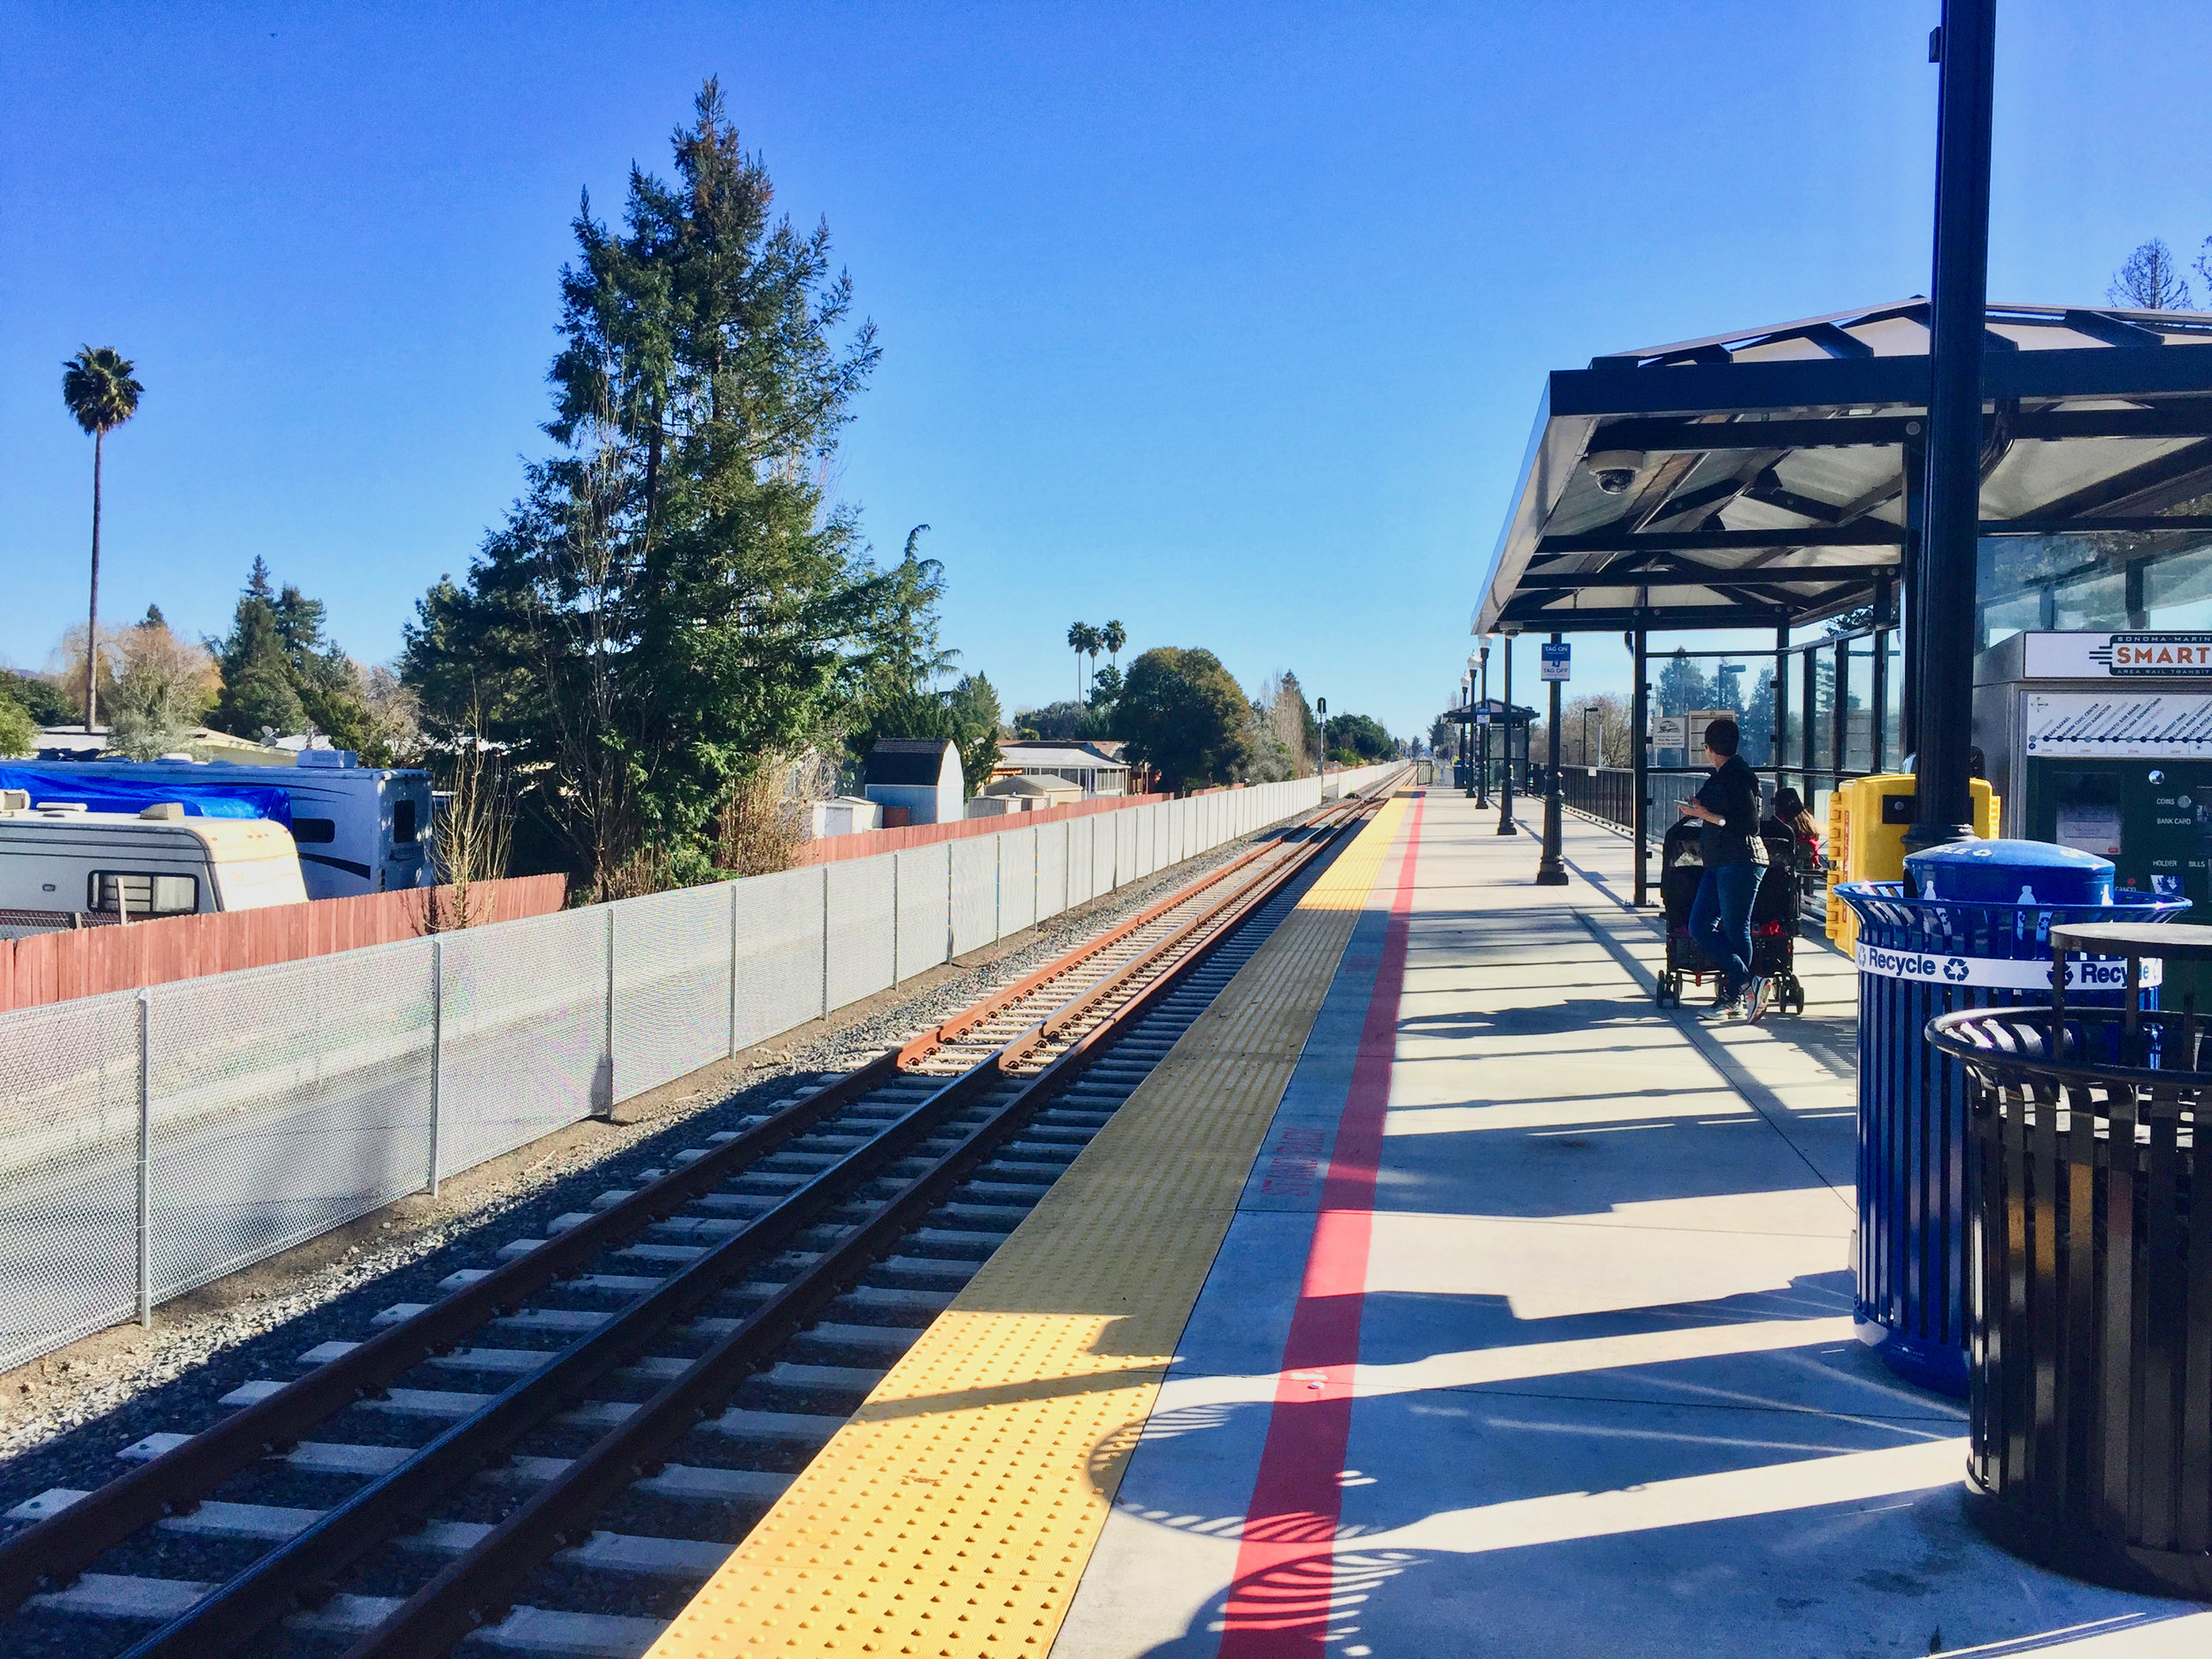
It’s unclear where such parking would be located along the Santa Cruz Branch Line. Picture where SMART stations like the ones above might go in the neighborhood nearest you?
Sources & Resources
Data cited is the best available at the time of publication. Santa Cruz County Greenway welcomes updates, corrections, and clarifications: info@sccgreenway.org
Population
Populations of Santa Cruz, San Francisco, Marin, and Sonoma Counties, United States Census Bureau, 2016
Population of Santa Cruz County, United States Census Bureau, 2016
Santa Cruz County Demographics, Santa Cruz Chamber of Commerce, 2015
Costs
How Much Money has SMART Spent? How much will be Spent before Measure Q Expires?, Marin Post, Mike Arnold Ph.D., 2016
Assessing the True Cannibalization Cost of SMART, Marin Post, Richard Hall, 2016
Trends In U.S. Rail Transit Project Cost Overrun [PDF], Transportation Research Board, 2006
Why It's So Expensive to Build Urban Rail in the U.S., CityLab, 2018 (primarily about subways, includes costs of light rail n U.S. and France)
The True Operating Costs Between Bus and Light Rail, ThoughtCo, 2017
Urban Rail Transit Projects: Forecast Versus Actual Ridership and Cost, Thoreau Institute
Ridership
On SMART [PDF], Sonoma-Marin Area Rail Transit District, Annual Report, 2017
Santa Cruz projections, Santa Cruz Branch Rail Line Rail Transit Feasibility Study [PDF], Santa Cruz County RTC
List of United States light rail systems by ridership, Wikipedia
Traffic
Traffic Volumes for Hwy 101, Caltrans, 2016
Traffic Volumes for Hwy 1, Caltrans, 2016
Top Employers
Santa Cruz County: 2017 Comprehensive Annual Financial Report Santa Cruz County
Santa Rosa: City of Santa Rosa, Dept. of Economic Development, 2017 data
Petaluma: Petaluma City's 2017 Comprehensive Annual Financial Report
San Rafael: San Rafael's 2016 Comprehensive Annual Financial Report (latest Available)
Distances
SMART Station Locations from SMART website
Santa Cruz proposed station locations from the Santa Cruz Branch Rail Line Rail Transit Feasibility Study (scenario G)
Distance to employers measured via Google Map
Fencing
Fencing requirements from the Monterey Bay Sanctuary Scenic Trail Network Master Plan [PDF], Section 5, Trail Design Standards
SMART train fence photograph in Rohnert Park CA by Santa Cruz County Greenway February 2018

Diesel Trains
RTC’s 2015 Rail Transit Feasibility Study (Sec. 8.2.4 p.151)
Photograph of the two-car Nippon Sharyo diesel train used by SMART

Fares
SMART Fares from SMART website
Santa Cruz County bus fares from Santa Cruz METRO website
Tree Removal
Rare Chimeric Redwood Tree In Cotati Replanted After Being Moved From Railroad Tracks, CBS SF Bay Area, 2014
Trail Width Matters by Santa Cruz Greenway and Alta Planning + Design
Bike Paths
SMART Pathway Lags Behind Rail by Marin County Bicycle Coalition, 2017
Rail: The Transportation Cannibal by Thomas Rubin, April 29, 2014
Santa Cruz County proposed trail diversions from the Monterey Bay Sanctuary Scenic Trail Network Master Plan [PDF]
Parking Spaces
Parking space estimates from the SMART web site, Wikipedia, and counted from satellite images on Google Earth
Photograph of SMART Rohnert Park Station by Santa Cruz Greenway February 2018
